The spectrum analyzer component shows a live frequency-spectrum view of audio, so you can visually monitor and analyze signal content in real time.
Attach the component to an audio component — such as a microphone or sine generator — to see its live frequency spectrum directly in the DSP Designer. It's configurable, with adjustable FFT length, window type, overlap, averaging, and a linear or logarithmic frequency axis.
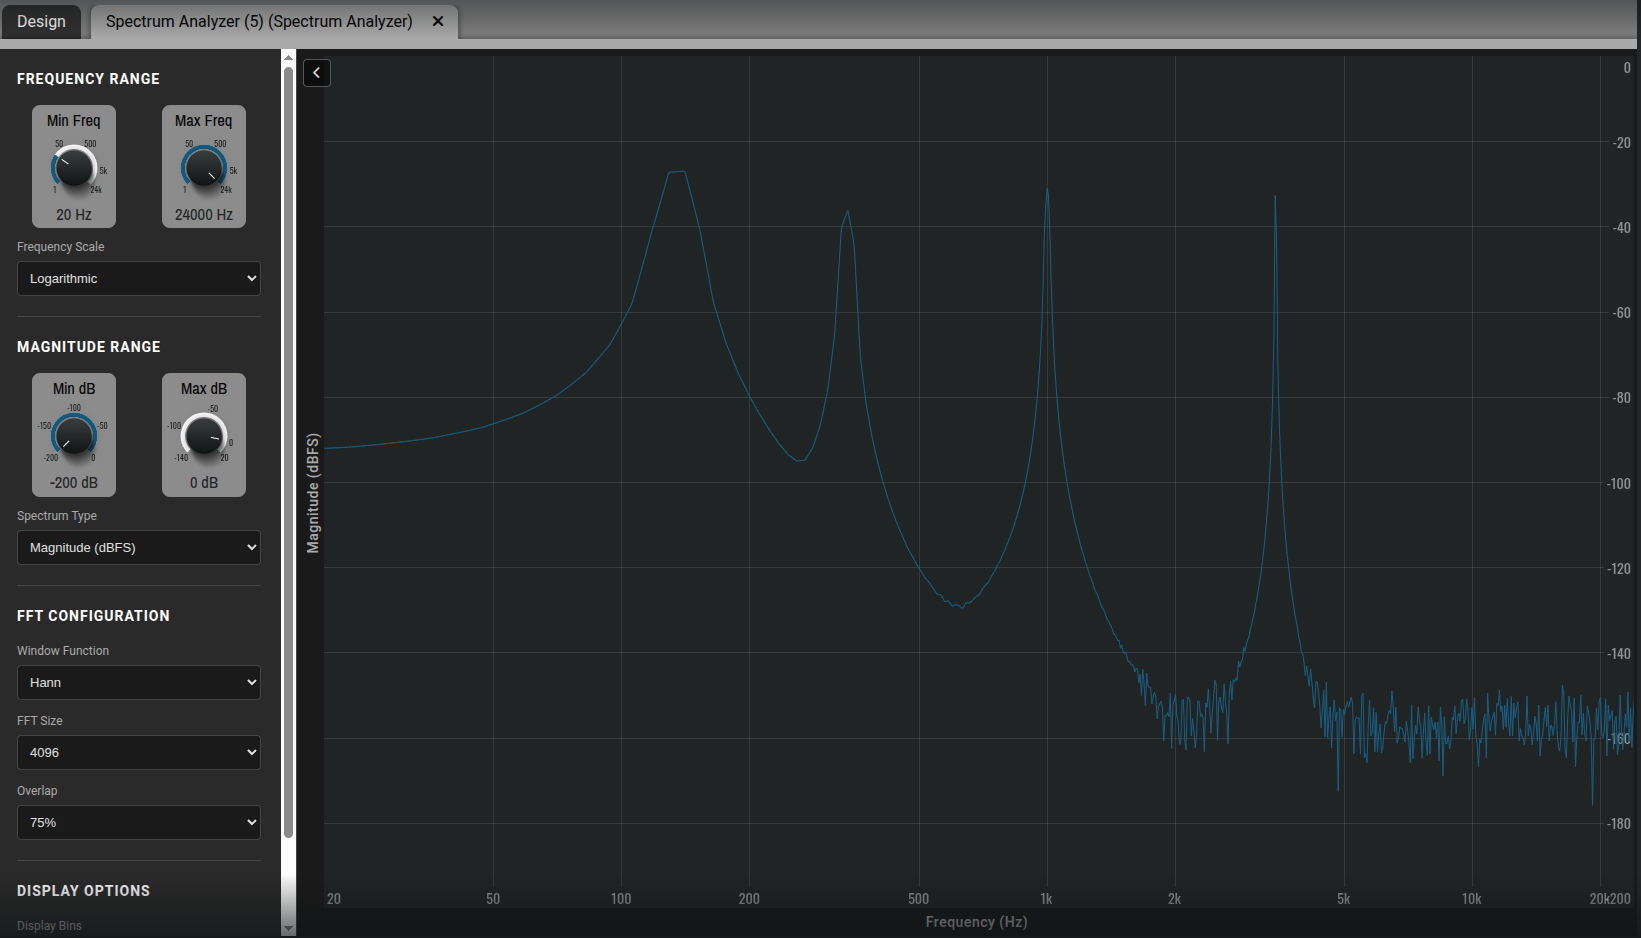
The Spectrum Analyzer opens in its own tab and shows a live frequency plot of whatever audio component it's attached to — frequency (Hz) along the horizontal axis and magnitude (dBFS) on the vertical axis. The display updates in real time, so you can watch the spectrum of a microphone, sine generator, or other source as it plays.
You can tailor the view with several controls:
Frequency Range — set the Min and Max frequency (here 20 Hz to 24,000 Hz) to zoom in on a band of interest, and choose a Logarithmic or linear Frequency Scale.
Magnitude Range — set the Min and Max dB (here -200 dB to 0 dB) to adjust the vertical scale, and pick the Spectrum Type (e.g. Magnitude in dBFS).
FFT Configuration — choose the Window Function (e.g. Hann), the FFT Size (e.g. 4096, which trades frequency resolution against responsiveness), and the Overlap (e.g. 75%) for smoother updates.
Display Options — additional view settings such as display bins (cut off at the bottom of the screenshot).
In practice, this lets you verify signal content and tuning directly in the Designer — for example, confirming a sine generator's tone sits at the right frequency, checking the frequency balance of a microphone, or spotting noise and unwanted peaks across the spectrum.