Description
Four power logging graphs are displayed to show performence for ampnode4 or 4LS.
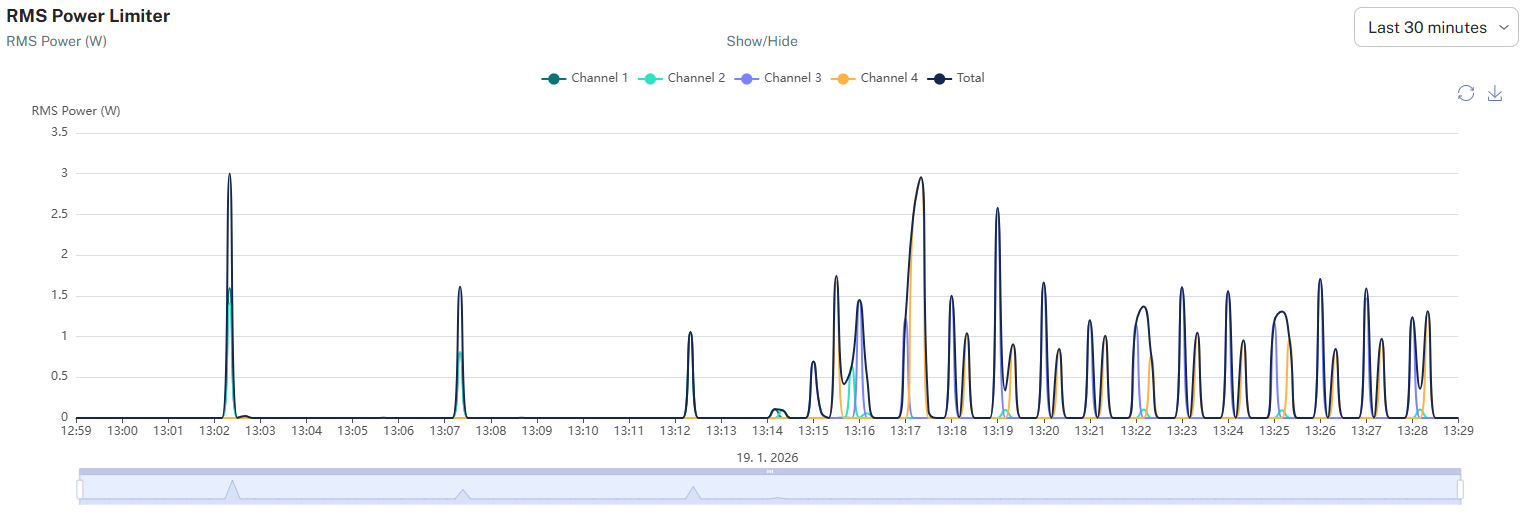
RMS Power Limiter
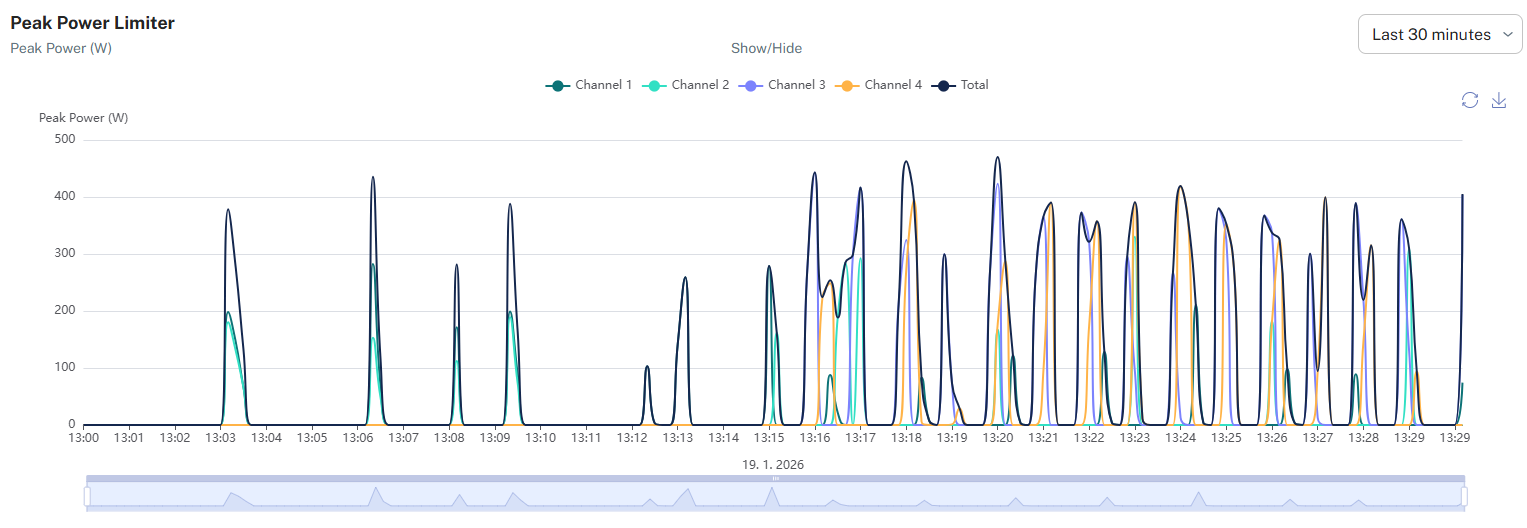
Peak Power Limiter
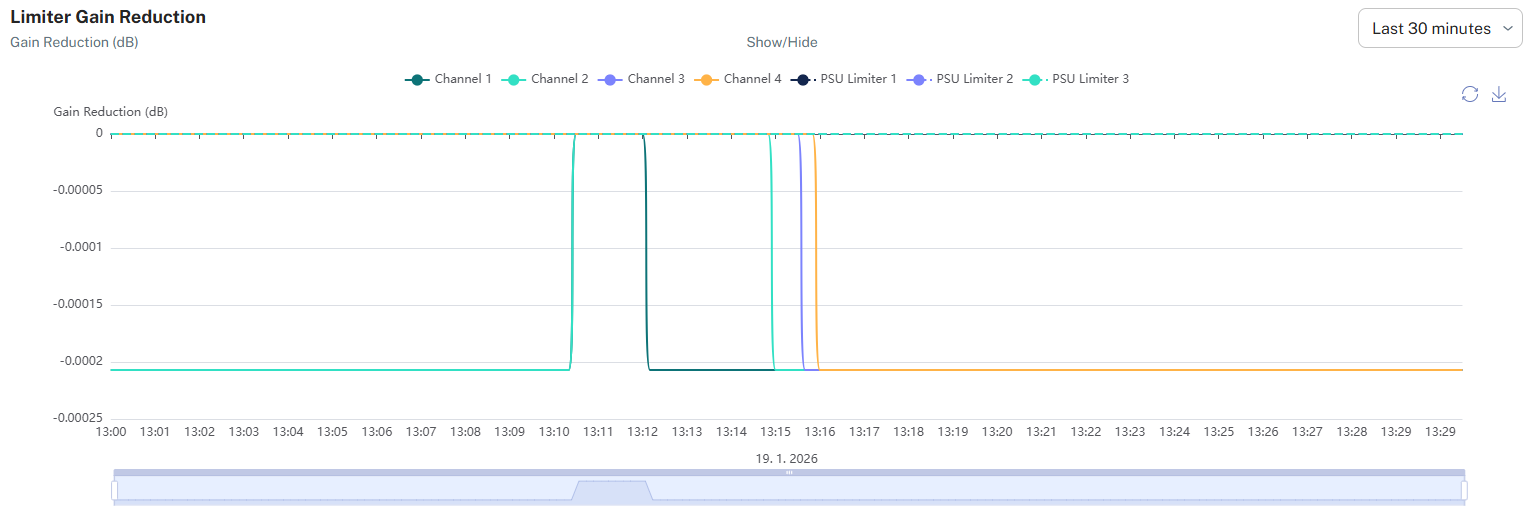
Limiter Gain Reduction
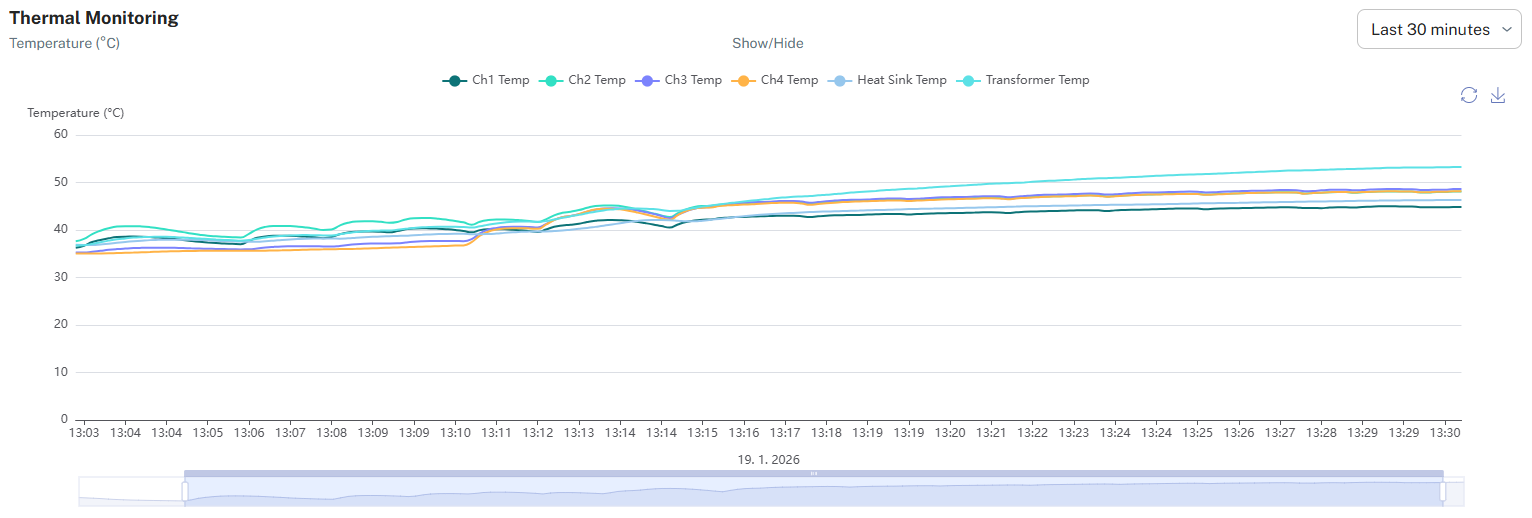
Thermal Monitoring
Setup features for the graphs
| All four graphs share the same time range. Changing the view in one graph also changes the view in the remaining three graphs. |
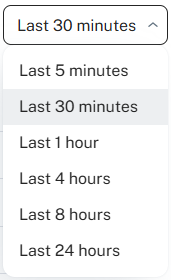
| Time range of the graph. |
| By clickng on the channels, they appear or disppear from the graph. |
| Refresh of the graph. |
| Saves the graph as image. |


Graph types
RMS Power Limiter: Logs and visualizes the continuous average power output for individual channels and the total system. |
|
Peak Power Limiter: Captures transient power spikes and maximum output levels in real-time. Helps identify dynamic limits and potential clipping points during high-energy signal bursts. |
|
Limiter Gain Reduction: Tracks protective attenuation activity across all channels and PSU rails. Shows when and by how many decibels the system reduces gain to protect the hardware. |
|
Thermal Monitoring: Provides a historical view of operating temperatures for all channels, the heatsink, and the transformer. |
|